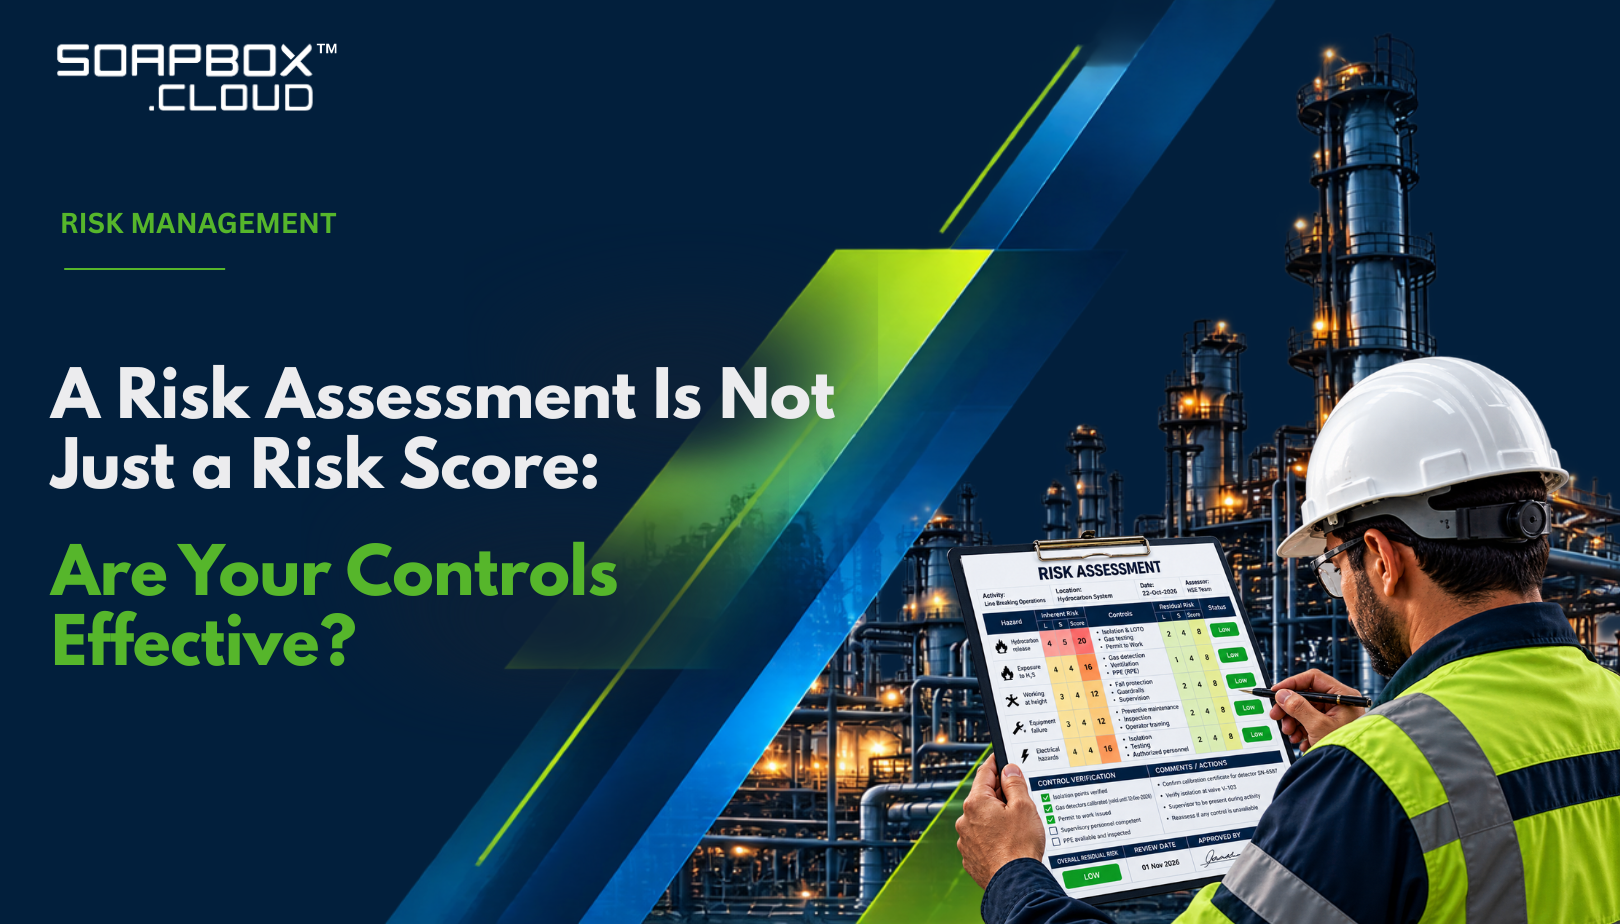
Most risk assessments are signed. Far fewer can demonstrate that the controls behind their residual scores are still effective.
Ask for a risk register at almost any facility and you may find hazards identified, likelihood and severity rated, controls listed, and residual risk shown in green during a risk assessment in safety. Then ask a second question: Which credited controls have been verified recently, what were the results, and what changed when a control failed or became unavailable? Where records are disconnected, that question can take days to answer.
This gap matters. Residual risk influences permit approvals, SIMOPS reviews, supervision, audit priorities and management decisions. If the evidence behind a score is weaker than the score suggests, those decisions may be based on a level of protection that does not exist in the field.
A risk score is a structured judgement about the likelihood and consequences of an unwanted event. Controls influence that judgement, but listing a control is not the same as demonstrating that it is available, correctly implemented and capable of performing when required.
Why a risk assessment score can hide weak controls
Consider a line-breaking task on a hydrocarbon system. On a 5 × 5 risk assessment matrix, the team rates inherent likelihood at 4 and severity at 5, producing a score of 20. It lists permit to work, an isolation certificate, gas testing, a toolbox talk and supervisor presence as controls. If the residual likelihood is then rated 2, the score falls to 10, assuming the matrix calculates risk as likelihood multiplied by severity.
That arithmetic may be correct within the chosen matrix. The key question is whether the evidence justifies changing the likelihood rating. Have the isolation points been verified? Is the gas detector suitable and in calibration? Is the person conducting the test competent? Is the required supervisor present and able to intervene? Are the controls available for this specific job, at this specific time?
If none of those questions has been answered, only the documentation has changed. A list of controls does not, by itself, establish that the likelihood of the event has fallen. The residual score should reflect the organisation’s defined risk methodology and the controls that can reasonably be relied upon-not simply the number of control phrases entered into a form.
ISO 45001:2018 addresses monitoring and evaluating the effectiveness of operational controls, while ISO 31000:2018 describes risk management as a process that includes monitoring, review and evaluation of risk treatment. For covered U.S. processes, OSHA’s Process Safety Management standard also requires a process hazard analysis to address the consequences of failure of engineering and administrative controls. These sources support the need to consider control performance; they do not prescribe one universal residual-risk formula.
How residual risk gets assumed instead of evidenced
Four recurring patterns can create a gap between the residual score in a register and the protection available in the field.
Controls are credited by name, not by performance
“Gas detection” is a label, not a complete performance requirement. A more useful description identifies the detector or system, the hazard scenario it addresses, the required alarm or trip function, relevant limits, test requirements, and the person or function responsible for maintaining it. The appropriate level of detail depends on the control, but the requirement must be specific enough to verify.
Administrative controls are credited without considering their dependencies
The hierarchy of controls places elimination, substitution and engineering controls ahead of administrative controls and PPE because they generally rely less on consistent human action at the moment of exposure. Procedures, toolbox talks and supervision can be important, but their effectiveness may depend on competence, workload, communication, shift handover and the ability to stop work. A matrix should not automatically give an administrative measure the same risk-reduction credit as a suitably designed and verified engineered safeguard.
Several listed safeguards may share one failure mode
A high-level alarm, an operator response to that alarm and an automatic trip may look like three safeguards. If they all depend on the same failed transmitter, power supply or communication path, they may not provide independent protection. In Layer of Protection Analysis (LOPA), a safeguard is credited as an independent protection layer only when it meets the relevant independence and performance criteria for the scenario. That criterion should not be confused with a blanket rule that every workplace control must be independent of every other control.
Controls can deteriorate after a risk assessment is approved
Detectors can be inhibited for maintenance, bypasses can remain open, inspection schedules can slip, contractors can change, and procedures can be revised through management of change (MOC). A risk assessment records a decision made at a point in time; it does not prove that the control configuration remains unchanged afterward or that risk control verification remains current. OSHA PSM requires covered process hazard analyses to be updated and revalidated at least every five years. That interval is not a substitute for ongoing inspection, testing, impairment management or review when significant changes occur.
What incident evidence says about controls that were never tested
Unverified controls are not just a documentation concern. Incident investigations repeatedly show how design assumptions, maintenance, changes and operating practices can undermine protection. The following figures provide context; they do not, on their own, prove that any one control caused an incident.
INDICATOR | WHAT IT TELLS US |
2.93 million | Estimated work-related deaths globally in 2019, including deaths from work-related diseases. |
44% | Share of primary causes classified as inadequate specification in HSE’s analysis of 34 control-system incidents. |
$181.4 billion | Estimated U.S. societal cost of work injuries in 2024. |
Read the HSE figure carefully. The Health and Safety Executive’s HSG238 analysis classified 56 causes across 34 control-system incidents. In that sample, 44% of primary causes were attributed to inadequate specification and 20% to inadequate change control after commissioning. HSE explicitly warned that the small sample had low statistical significance and should not be generalized to all control-system failures. The percentages are useful as lessons from the cases reviewed-not universal failure rates.
The Buncefield oil storage depot incident in the United Kingdom illustrates why a listed or installed safeguard cannot be assumed effective. On 11 December 2005, a storage tank overfilled, petrol vapour formed and ignited, causing major explosions and fires. More than 40 people were injured; there were no fatalities. Investigations identified failures in tank-level monitoring and overfill-prevention arrangements. The automatic tank gauge indicated that the level was static while the tank continued to fill, and the ultimate high-level protection did not successfully prevent the overfill.
The lesson is not that paperwork is useless. Risk assessments, specifications, test plans and records are essential. The lesson is that documents need to connect to the actual condition and performance of the barriers they describe.
The Control Evidence Ladder: five stages from listed to demonstrated
The Control Evidence Ladder is a proposed practical framework for asking how much evidence exists that a particular control is capable of doing its job. Each stage builds on the previous one. The ladder is not a prescribed ISO, OSHA or API model; it is a way to organise assurance evidence and expose gaps.
NO. | STAGE | WHAT IT MEANS | EXAMPLE EVIDENCE |
1 | Listed | The control is named in a risk assessment, JSA or PHA. | The assessment record alone. |
2 | Specified | Its required function is defined: the scenario, performance criteria, limits, owner and response where relevant. | A performance standard, control specification or equivalent documented requirement. |
3 | Implemented | The control is present and configured as required, and the people expected to use it are trained and competent. | Commissioning or implementation records, field checks, and relevant competence records. |
4 | Verified | Its condition or performance is checked at a defined frequency, results are recorded, and deficiencies are escalated. | Current inspections or test records, results, dates, and linked corrective actions. |
5 | Demonstrated under challenge | Evidence shows how the control performs during a genuine demand or a suitable, realistic test or drill. | Demand records, functional-test or drill results, investigations and performance trends. |
From a phrase to a performance requirement
Many risk registers record only the control name. Moving beyond that stage requires the organisation to define what the control must do and under what conditions. For example, “supervision” could become “a designated supervisor with current confined-space supervisory competence remains available at the entry point for the duration of the entry and has authority to stop the task.” That makes the arrangement more observable and auditable.
Evidence over time matters
Implementation evidence shows that a control was put in place; it does not establish that the control remains effective months later. Verification needs a defined method and frequency appropriate to the control, recorded results, clear acceptance criteria and a response to deficiencies through control verification. Some controls require a functional or proof test; others are better verified through competency records, field observation, audits or exercise results.
A proposed rule for crediting controls
For controls that an organisation has designated as requiring formal verification, this framework recommends granting residual-risk credit only where current evidence shows that the control meets its defined requirements and has no unresolved impairment that prevents it from performing. This is a proposed governance rule, not a universal requirement stated by ISO, OSHA or API. Organisations should adopt and apply it through their own risk-management procedure.
A failed test means the control has not demonstrated the required performance. The assurance process is working as intended only if the failure is detected, the appropriate response is initiated, and affected risk assessments are reviewed. The risk should be reassessed against the remaining credible controls and any suitable interim measures; it should not automatically be assigned the original inherent score in every case.
This is the gap digital HSE workflows can help address: linking credited controls to their specifications, verification records, impairments and corrective actions, so that a change in control status prompts the right risk review.
Three field scenarios where the score stayed the same but the risk changed
The following are illustrative scenarios, not claims about a specific site or incident. Each shows how a residual score can become unreliable when the evidence behind a credited control is not current.
SIMOPS on a live refinery unit: one overdue detector, one inhibited
Hot work is planned on a pipe rack beside a live hydrocarbon line during a partial shutdown. The SIMOPS assessment credits fixed gas detection with a control-room alarm and assigns a residual score of 6 on a 25-point matrix.
During the pre-job walk, the area authority asks when the two nearest detectors were last verified. One is four months overdue for its required bump test. The other was inhibited during instrument work the previous week and has not been reinstated. The first detector is unverified; the second is known to be unavailable. The available evidence is not sufficient to rely confidently on either detector as credited.
The team pauses the job and applies the site’s impairment and permit procedures. It verifies the overdue detector, restores and function-tests the inhibited detector through the approved process, considers suitable interim monitoring, and reassesses the risk before authorising work. The critical point is that the score must reflect the verified control state-not the value that was entered before the walkdown.
Work at height on an EPC site: a green tag without a valid inspection basis
A JSA for steel erection credits “scaffold inspected and tagged by a competent person.” Every scaffold carries a green tag. Following high winds, a crew prepares to resume bolting work before shift change.
A review finds that the required inspection was signed by someone whose scaffold-inspection competency has not been established, and the site’s procedure for post-weather checks was not followed. The tag exists, but it does not provide sufficient evidence that the scaffold meets the required condition. The immediate response is to restrict access until a competent inspection is completed and any defects are addressed.
The lasting correction is to define inspection competency, specify reinspection triggers in the site procedure, record the inspection result and make the verification visible to the person authorising the work at height. Replacing the tag alone would not resolve the assurance gap.
The auditor’s request: evidence takes three days to assemble
An auditor asks for all line-breaking risk assessments rated Medium or lower in the previous 12 months and, for each credited control subject to verification, the date and result of its most recent check.
The team spends three days matching risk assessments to maintenance records, permit files, training matrices and MOC logs. Some controls cannot be linked to a verification record; others are affected by temporary bypasses whose close-out status is unclear. The central finding is that the organisation cannot quickly demonstrate whether the protection credited in the register remains available and effective.
The answer is not necessarily to create more forms. It is to establish reliable links between the risk assessment, the control, its verification evidence, its current impairment status and any corrective action.
Turning control effectiveness into a leading indicator
API Recommended Practice 754 provides a four-tier process-safety indicator framework. In August 2026, API published its fourth edition, which updates definitions, data capture and examples. The standard distinguishes indicators suitable for public reporting (Tiers 1 and 2) from those intended for internal use (Tiers 3 and 4). The proposed measure below is complementary to that framework; it is not an API RP 754 metric.
The Control Evidence Ratio
A practical KPI proposed here is the Control Evidence Ratio: the percentage of controls credited in residual-risk assessments, and subject to defined verification requirements, that currently have satisfactory verification evidence and no unresolved impairment that prevents them from meeting the defined performance requirements.
Control Evidence Ratio = (Controls currently verified effective ÷ Controls requiring verification) × 100
The denominator must be defined consistently, and reporting should be segmented by facility, unit, contractor or hazard type where useful. Controls with overdue checks, failed results or an unresolved impairment should not count as currently verified effective. A rising ratio is meaningful only if the quality of verification and the completeness of the underlying records are maintained
Three operating rules
A failed or overdue verification triggers review. Reassess the affected risk using the controls that remain available and appropriate interim measures; do not continue to rely on the impaired control without evidence.
A real demand provides valuable evidence. Record when a barrier successfully prevents escalation as well as when it fails. Link the event to the relevant control, investigation and follow-up actions.
Change must reach the risk register. MOC, bypasses, temporary overrides, maintenance impairments and significant procedural changes should identify which credited controls and risk assessments may be affected.
What mature organisations do differently
Organisations with credible risk registers focus assurance effort on the controls that matter most to major hazards. They define performance requirements, assign ownership, set verification methods and frequencies that reflect the control’s criticality, and establish clear acceptance criteria. They also make the consequences of failed verification explicit: who is notified, what work must pause, how risk is reassessed, what interim safeguards are permitted and who can authorise a return to service.
They close the loop between risk assessment and the processes that test control performance. Inspection findings, PTW audits, near-miss reports, root-cause analyses, maintenance records and MOC decisions are linked to the relevant controls. When a control’s status changes, the people who rely on it can see that change and assess whether the risk rating and operating decision remain valid.
The goal is not to test every control in the same way or to build a larger register. It is to make each credited control specific enough to verify and to ensure that evidence is available to the person making the decision.
The question a disconnected risk register struggles to answer
“For every risk currently rated Medium or lower, which credited controls have a failed, overdue or missing verification right now-and how should those risks be reassessed without those controls?”
A spreadsheet can store the risk register, inspection history, permit records and MOC log. With careful design, spreadsheets can also connect data and recalculate scores. The difficulty arises when records are fragmented, identifiers are inconsistent, owners are unclear or updates do not flow reliably between records. Manual reconciliation then becomes slow and error-prone.
An integrated HSE platform can support a stronger process when it links controls to their risk assessments, verification records, impairments, corrective actions and change workflows-and makes changes visible to the people who need to act. The technology is not a substitute for sound risk criteria, competent verification or management follow-through. It helps make those practices traceable and usable at the point of decision.
If your team can answer the question quickly and reliably, the residual-risk score is more likely to represent the control state that exists today. If it takes days, the register may be describing the protection the organisation intended to have rather than what it can currently demonstrate.
About the author
Hasan Ahmed Sayed is an HSE professional with more than 12 years of experience across construction, EPC, industrial, shutdown and turnaround projects. As an HSE SME at SoapBox Software Solutions LLP, he brings field experience into the design of digital HSE requirements, workflows and assurance practices.
References
The links below support the factual statements and standards references in this article. Always consult the applicable current edition of a standard when establishing compliance requirements.
[1] International Labour Organization (2023), A Call for Safer and Healthier Working Environments. Global estimates for 2019 include approximately 2.93 million work-related deaths. https://www.ilo.org/publications/call-safer-and-healthier-working-environments
[2] Health and Safety Executive (2003), HSG238: Out of Control - Why control systems go wrong and how to prevent failure. Second edition. See the analysis of 34 incidents, Table 2 and the warning about statistical significance. https://www.hse.gov.uk/pubns/priced/hsg238.pdf
[3] National Safety Council, Injury Facts - Work Injury Costs. Reports estimated U.S. societal costs of work injuries of $181.4 billion for 2024. https://injuryfacts.nsc.org/work/costs/
[4] ISO 45001:2018, Occupational health and safety management systems - Requirements with guidance for use. See clauses 8.1.2 and 9.1.1; Amendment 1:2024 adds climate action changes. https://www.iso.org/standard/63787.html
[5] ISO 31000:2018, Risk management - Guidelines. Guidance on risk assessment, treatment, monitoring, review and effectiveness. https://www.iso.org/standard/31000
[6] International Organization for Standardization, ISO 45001:2018/Amd 1:2024. Climate action changes amendment to ISO 45001:2018. https://www.iso.org/standard/88428.html
[7] Occupational Safety and Health Administration, 29 CFR 1910.119 - Process safety management of highly hazardous chemicals. See paragraphs (e)(3)(iv) and (e)(6), applicable to processes covered by the U.S. PSM standard. https://www.osha.gov/laws-regs/regulations/standardnumber/1910/1910.119
[8] Center for Chemical Process Safety / AIChE (2015), Guidelines for Initiating Events and Independent Protection Layers in Layer of Protection Analysis. Guidance for applying LOPA and assessing independent protection layers. https://ccps.aiche.org/publications/books/guidelines-initiating-events-and-independent-protection-layers-layer-protection-analysis
[9] Health and Safety Executive, Buncefield investigation and reports. Incident background and links to investigation reports on the 11 December 2005 explosion and fire. https://www.hse.gov.uk/comah/buncefield/
[10] American Petroleum Institute (6 August 2026), API Publishes Fourth Edition of Process Safety Performance Indicators Standard. Announcement for API Recommended Practice 754, Fourth Edition. Consult the standard itself for its detailed definitions and examples. https://www.api.org/news-policy-and-issues/news/2026/08/06/api-publishes-fourth-edition-process-safety-performance-indicators-standard